Google Analytics for Improving Websites
Know how well your website is performing? Your best converting traffic sources? Which pages to improve first? These are all really important questions you should know answers to.
To help you understand the answers to questions like those, and about your overall website performance, its essential that you use a web analytics tool like Google Analytics.
So that you can use it to help improve your website sales or leads, here is a great short and sweet Google Analytics guide for you. Let’s get started…
What is Google Analytics?
It’s the best free web analytics tool to help you analyze and improve the performance of your website, pages and visitors. Using a small snippet of code it tracks your visitors on all of your key pages. Knowing how to gain great insights from Google Analytics is essential though, and this guide gives you a great kick-start.
What are the benefits of using Google Analytics?
Rather than guessing how well your website and content is doing, Google Analytics arms you with key metrics and insights to help you improve it – to gain more traffic, and to increase the amount of visitors converting into your website goals like sales, signups or subscribers.
Google Analytics helps you understand key things about your website:
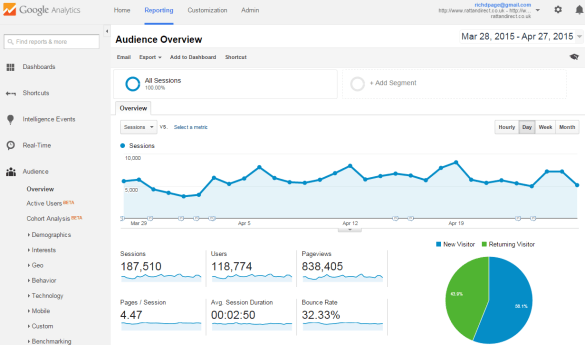
- Overall performance and trends of your website – e.g. total visitors, pageviews and conversion rate
- Performance of your pages – e.g. visitors, bounce rate and conversion rate per page
- Performance of your traffic sources – e.g. your SEO, paid search, social media and email marketing
- Great insights for improving your website (what pages are performing badly/what to improve first)
Here are the other great benefits of Google Analytics:
- It’s completely free to use, and is nearly as good as paid tools like Adobe Analytics
- It’s really easy to setup, just needing one small snippet of Javascript
- It’s got a really user friendly interface, that keeps improving every year
- It doesn’t slow your website load time, and integrates well with other tools
How to get started with Google Analytics
How to use Google Analytics? Well here are some steps to get it up and running on your website and start tracking your traffic and visitors – just like how an analytics pro would!
- Install the Google Analytics tracking code on your website (this guide is useful for helping)
- Check data seems it’s coming in as expected and check code is on all pages (this debugger helps)
- Get to know the interface (navigate through key report types like audience and acquisition, change dates, sort tables etc)
- Setup your conversion goals to see how well your website converts visitors into goals (great guide)
- Turn on the Google Webmaster Tools integration so you see your top search keywords
- Setup a dashboard showing your key website metrics and check it regularly
- Setup alerts to let you know when your key website metrics change suddenly
Which Google Analytics features are most useful?
There are so many reports, metrics and features in Google Analytics. You only really need to regularly use about 50% of them though – here are the most beneficial ones for helping to improve your website:
Most useful reports to look at regularly:
- Top pages report (your top 10 pages, and bounce rates)
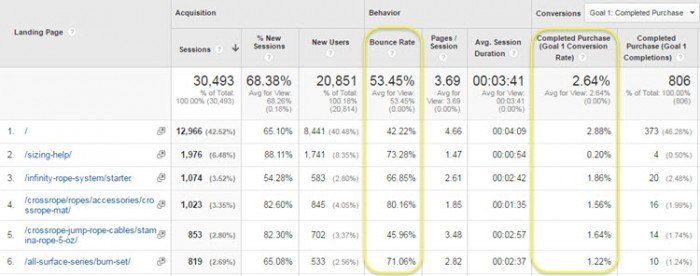
- Top landing pages report (key for improving these first – screenshot below)
- Navigation path reports (to know where visitors usually click)
- Top traffic channel report (to see which working well/not well)
- Top referrers report (to see which site links send most traffic)
- Goals overview report (so you see overall site conversion rate)
- Funnel visualization report (so you can see drop-off rates)
- Mobile overview report (to see your % of mobile/tablet visitors)
- Page speed report (to help you speed up your site load times)
- Real time overview report (for seeing who is on your website)
Below you can see an example of the highly useful landing pages report, with the most useful metrics highlighted – bounce rate and goal conversion rate.
Most useful metrics to understand and monitor:
- Visitors (site total and per page)
- Pageviews (site total and per page)
- Bounce rate (visitors who leave without clicking anything – site total and per page)
- Exit rate (visitors who leave at any time – site total and per page)
- Goal conversion rate (for your major goals like sales – site total, and per page/traffic source)
- Repeat visit rate (how often visitors come back – site total)
Most useful features to use regularly:
- Visitor segments (particularly first time versus repeat, by traffic source and by browser)
- Goal tracking (the ability to track any goals like a sale or a newsletter signup)
- Campaign tracking (to track your email marketing performance and other ads)
- In-Page click map (so you can visually see what visitors are clicking on your pages)
- Customizable dashboards (to see all your key metrics and reports on one page)
- Event tracking (to track PDF downloads, video players and other non-page content)
- Intelligence alerts (to help you monitor for big changes in your metrics)
Other great resources to help you with Google Analytics
To help you get even more out of Google Analytics, here are some great guides, books and services:
- The Best Google Analytics Reports For Improving Websites (article)
- The complete guide to setting up Google Analytics (article)
- Google Analytics Insights service (actionable insights from an expert)
- Google Analytics advanced segments tips (article)
- 10 Ways to prove SEO value in Google Analytics (article)
- Web Analytics 2.0 by Avinash Kaushik (book)
- Advanced Web Metrics with Google Analytics (book)


Or You Get Your Money Back